The economy remains imbalanced and uneven, with signs of strength in the industrial production and public demand offset by weakness in exports and credit to the private sector. Inflation remains persistent, with policy settings inappropriately loose as late as the autumn of 2023.
Economic activities
According to the newly published quarterly national accounts, the economy slowed sharply in early 2023 before staging a recovery in the mid-year (Chart 1). Much of the weakness was concentrated in the services sector.
In contrast, the industry sector appeared to be more resilient. The strength in the sector have continued into the autumn of 2023 according to the strong recovery in industrial production (Chart 2). This series is a strong correlate of GDP growth. If the historical relationships between the two indicators have held, the economy could have been staging a strong recovery in late 2023. However, there are grounds to be cautious about such a rosey interpretation.
Exports, for example, have ground to a halt in the second half of 2023 (Chart 3). Imports, of course, have been declining for much of 2023 (Chart 4), reflecting the severe restrictions. That is, net exports might have made a positive contribution to growth in the second half of 2023. However, the exports slowdown means one of the economy’s engine of growth has been spluttering, clouding the overall economic outlook.
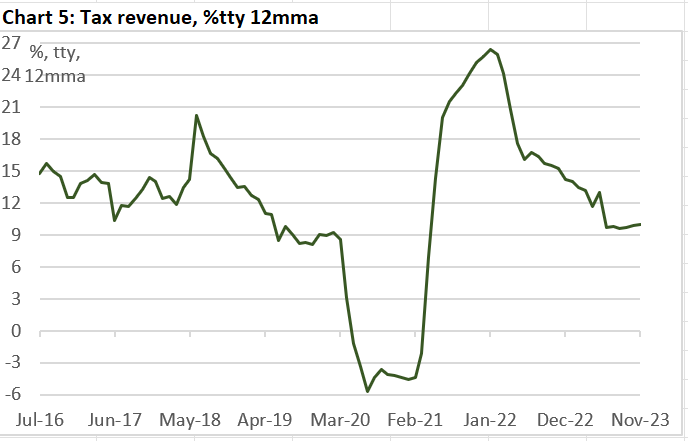
Tax revenue is another correlate of economic growth. Tax revenue growth slowed in the second half of 2023 to a pace that is slower than pre-pandemic growth rates. This is not surprising because import taxes would have declined in line with falling imports. If the historical relationship between tax revenue and GDP growth have held, economic growth in late 2023 could have been soft.
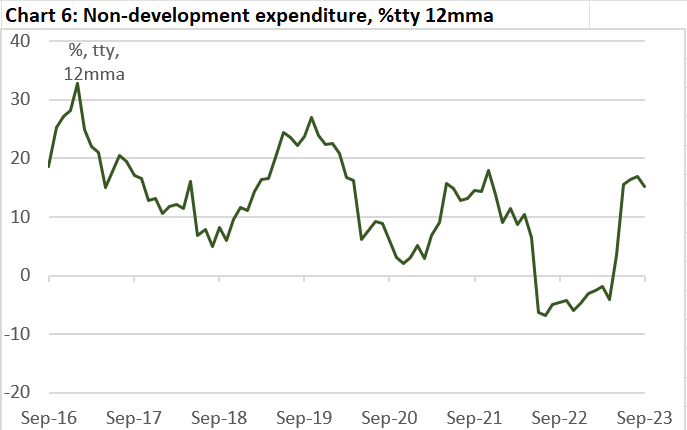
Turning to the other side of the public finance ledger, both non-development and development expenditures grew in the first quarter of 2024-25 fiscal year after the decline in the previous year. That is, public demand likely to have contributed to economic growth in the September quarter of 2023.
There isn’t, however, any clear sign of strength in the private sector demand. Growth in credit to the private sector is an oft-used proxy for private investment. This series slowed throughout 2023 (Chart 8), suggesting continuous weakness in the corporate sector.
This would imply that any strength in the private domestic demand would have had to be in the household sector. Electricity sale (and generation) is a widely used correlate of economic growth. However, the series have not been updated since June 2023 (Chart 9).
Prices and income
The picture remains mixed when one considers indicators of prices and income. The wage rate index continued to grow strongly throughout 2023 (Chart 10). However, inflation has been even higher (Chart 11), suggesting an erosion of real income.
However, food price inflation moderated in the winter. This is also reflected in a decline in the price of rice in Dhaka (Chart 12).
The Khichuri Indicator is a simple measure of the living standard of the urban worker. It shows the number of plates of khichuri — rice, lentil, oil and salt — one can buy on the daily wage of a skilled industrial worker. While it remains far lower than the pre-pandemic peak, the indicator does show a slight uptick in the autumn of 2023.
One positive sign in the economy is the near record number of Bangladeshis going overseas to work (Chart 14). To the extent that the labour markets in the hosting countries are booming, the outflow workers should result in a strong inflow of remittances.
Formal remittances, however, remain sluggish (Chart 15). To the extent that remitters are still relying on the informal hundi channel, this could mean expectations of further depreciation of the taka.
Policy settings
Draconian import restrictions did not prevent the taka from sliding in 2023. Nor did it stem the bleeding of the stock of international reserves held by the Bangladesh Bank (Chart 16). Measured in terms of the months of imports, reserves appear to remain in the ‘safe zone’ of above three months. However, this is because imports have been slammed with policy measures.
The effect of the recent policy announcements regarding the ‘crawling peg’ is yet to be seen in the data. Nor are the effects of new monetary policy visible in the interest rate. Particularly, real interest rates remained firmly in the negative territory in the autumn of 2023 (Chart 17) — suggesting money was cheaper than free for those who could get it. Meanwhile, public sector borrowing continued to grow strongly into the winter (Chart 18). That is, macroeconomic policy settings were still inappropriately loose for the inflationary environment.
Data source: the Bangladesh Bureau of Statistics, the Bangladesh Bank, and other official agencies, via the CEIC Asia database. Data have been smoothened with moving averages as indicated. The latest period of the series is indicated in the chart. Further details are available upon request.
Further reading
Nowcasting Bangladesh’s economy
Abul Kashem, 1 Jan 2024
মন্দায় জাহাজ ও কনটেইনার হ্যান্ডলিং কমেছে
সাইফুল আলম, 3 Jan 2024
What car sales data tell about wealth distribution in Bangladesh
Shadique Mahbub Islam, 17 Jan 2024
ট্রেজারি বিল-বন্ডের ৭৭% কিনেছে বাংলাদেশ ব্যাংক
রোহান রাজিব, 23 Jan 2024
কয়লা ও আমদানি বিদ্যুতের দাপট, কমবে তেল-গ্যাসভিত্তিক উৎপাদন
ইসমাইল আলী, 23 Jan 2024
The middle class dream of owning a car is going up in smoke
Masum Billah, 25 Jan 2024
Bangladesh's bond market one of the smallest in Asia. What will strengthen it?
Sakhawat Prince and Jebun Nesa Alo, 25 Jan 2024
Even in days of high inflation, people in Bangladesh saved more
Jebun Nesa Alo, 27 Jan 2024
বিদ্যুৎ-জ্বালানিতে বিপুল বকেয়া
মহিউদ্দিন, 28 Jan 2024
The case for preserving the value of the Taka
Waseem Alim, 29 Jan 2024
BB to give interest-free ‘special loan’ to Islamic banks
Mostafizur Rahman, 30 Jan 2024
Govt rolls back export incentives as LDC graduation nears
Jasim Uddin and Sakhawat Prince, 30 Jan 2024


Decent growth in the manufacturing sector despite low growth in exports suggests that the domestic household is consuming more manufactured products? Is the import restrictions resulting in some import substitution? Do you happen to have sector by sector data to show where the growth in industry is coming from?
Do you have a data source showing the growth of solar and batteries for private household, commercial and industrial use? All I can find it is the solar deployed by the state owned utility.