The Khichuri Indicator
A simple metric shows living standards are stagnating for the urban working class

A staple of political rhetoric in Bangladesh is to ensure the affordability of rice, lentil, oil and salt — the poverbial chaal, daal, tel, noon. Throw in a kilogram of coarse rice, 250 grams of red lentil, 40 ml soya bean oil and 10 mg salt and we get a rather bland plate of khichuri.
Still, using the bland recipe and prices of these items, we can get a sense of how the price of our plate of khichuri has evolved over time — for example, when BNP was turfed out in January 2007, such a plate cost around 34 taka, which had risen to around 58 taka when the Awami League returned to power in January 2009, and was around 97 taka as of December 2022.
Of course, to say anything sensible about prices, we need to have a sense of income. A skilled factory worker in Dhaka earned 165 taka a day in January 2007, which had risen to 237 taka two years later, and stood at 520 taka as of last December.
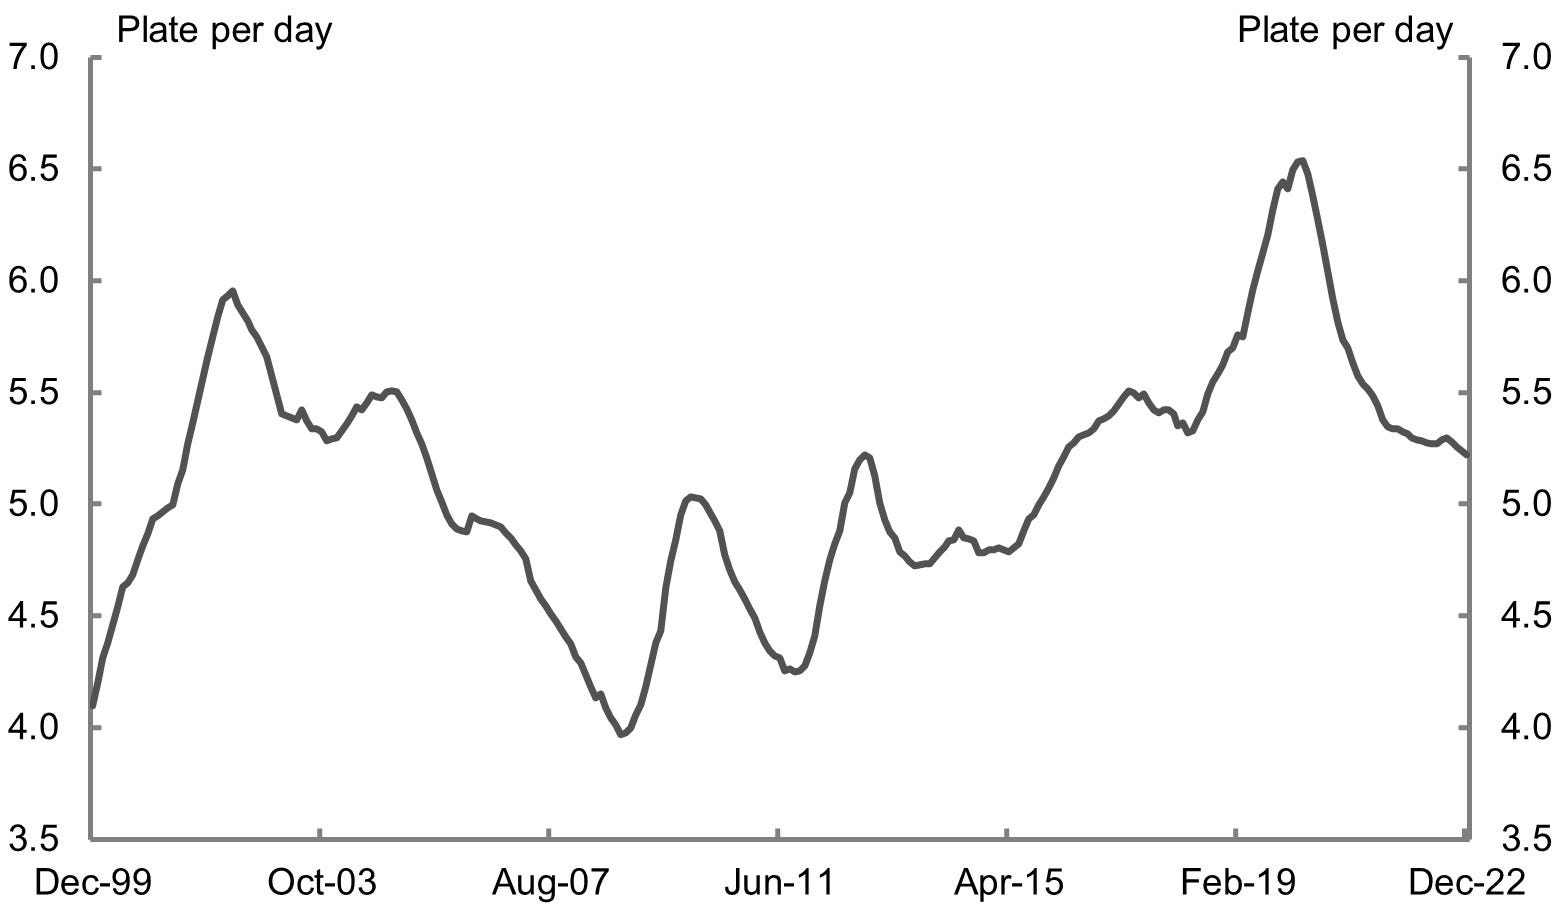
Putting the two together, we can get what I am going to call the Khichuri Indicator — plates of khichuri an average industrial worker can buy in Dhaka. The chart below shows how the Indicator has evolved between March 1999 and December 2022.
Of course, one has to cook this khichuri using some gas, which has become more expensive over time. And on can’t just eat khichuri, one has to live somewhere too. Also, our factory worker needs to send her children to school, and possibly send money to the villages and so on. Further, factory workers aren’t the only people who live in Dhaka — we would want to know what’s been happening to the income of the middle classes who work in various services. And the average factory worker of 2002 would have a very different life from the average factory worker of 2022 — the latter probably has a phone the former could not even imagine.
That is, we should not treat this stylised indicator as a substitute for official statistics.
But this stylised index has the virtue of being simple and intuitive to people without formal economics training (that is, most normal people). In fact, national accounts or balance of payments statistics are not obvious to many people with formal economics training, and 8 percent GDP growth and $40 billion reserves are completely meaningless to most people. In contrast, the simple Khichuri Indicator is a rough and ready look at how the living standards of Dhaka’s urban working class has evolved over the past two decades.
We can see a few clear trends in the data.
In the first few years of the century, the indicator steadily rose — wages rose faster than prices, these were good times for Dhaka’s working class. During the first few years of the third BNP government, a skilled industrial worker in Dhaka could afford around 5.5 plates of khichuri a day.
However, things worsened in the middle of the decade — even as wages continued to rise, prices rose even faster. The Khichuri Indicator started falling towards the end of the BNP government, and nosedived under the 1/11 regime, reaching a nadir of around 4 as the December 2008 election neared.
Awami League won that election by promising 10 taka per kilogram of rice. According to the Khichuri Indicator, however, the urban working class living standards didn’t return the BNP era mark of 5.5 until the end of Hasina Wajed’s second term.
The years preceding covid-19, however, were indeed great times for the urban working people, with the indicator reaching a peak of 6.5 in April 2020.
Of course, much of that gain has been wiped out by the pandemic and its aftermath, with prices rising much faster than income. In December 2022, a skilled factory worker could afford only 5.2 plates of khichuri a day.
Put differently, this simple metric would suggest that the working poor of Dhaka has not really seen much of a change in their living standard in two decades.
The surge of working class young people in opposition rallies may well have something to do with the movements in our Khichuri Indicator.
All data are from CEIC Database. Missing data have been filled in with a simple extrapolation. Data have been smoothed by taking a 12-month moving average.
The Indicator will be updated regularly.
Further reading
শাওন ও নয়নরা নতুন কিছু বলছে কি
আলতাফ পারভেজ, 26 Dec 2022
Why is inflation so sticky in Bangladesh?
Nasif Tanjim, 18 March 2023
The Economist, 28 March 2023
আইএমএফের শর্ত কি মানুষকে নতুন দারিদ্র্যের মুখে ঠেলে দিচ্ছে
ফয়েজ আহমদ তৈয়্যব, 3 April 2023
The Economist, 6 April 2023
Zahid Hussain, 7 Aptil 2023
Zahid Hussain, 9 June 2023
New monetary policy: Promising changes, but there're areas for improvement
Selim Raihan, 18 June 2023
And that promise of 10 taka rice.
Rice prices were around 65 taka a kg in late 2022.