Economy in the Rear View Mirror
What do the recent national accounts revision mean for the reliability of pre-COVID GDP growth as well as the impact of the pandemic?
The Covid-19 pandemic and associated lockdowns have posed a serious challenge to economic bean counters around the world, who had very little experience to model how the economy would evolve during the pandemic. So it was little surprise that the economic indicators across the world had been swinging violently, seesawing between sharp contractions and rapid recoveries.
More surprising were the initial official estimates that had the real GDP in Bangladesh growing at 5-6% in the two pandemic-hit financial years. That is, the official figures painted a pace of growth that was commonplace not that many years ago, even if the numbers were inconsistent with the lived realities of households and businesses alike.
Further, the official GDP figures were inconsistent with the partial indicators, also published by the government, that showed a sharp economic slowdown after March 2020.
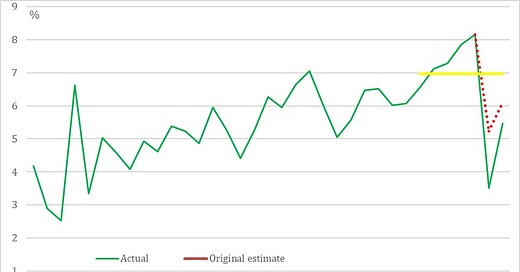
The latest Bangladesh Bureau of Statistics national accounts figures are more credible, showing that the economy was indeed hit hard by the pandemic (Chart 1), with real GDP growth slowing down to its weakest rate since 1990-91 —a year beset by the fallouts of the first Gulf War and the democratic uprising against the regime of Lt Gen HM Ershad.
Chart 1: Real GDP growth
Further, the economy is yet to recover to pre-pandemic trends. In the five years to 2018-19, the economy was growing on average by 7% a year. The economy in 2020-21 was still 4.6% smaller than the level that would have been achieved had that trend continued.
Of course, there have been questions about the reliability of the pre-pandemic GDP figures, which the BBS has not revised. For example, the same partial indicators that have been used to challenge the initial estimates of the pandemic era GDP figures can be used to analyse the economic growth of the past decade. In what follows, we will attempt something simpler, looking mainly at the national accounts that underpin the growth numbers to understand the economy before the pandemic.
Let’s first consider the production side of the national accounts. This measure counts the real value (that is, after accounting for inflation) of all the goods and services that have been produced in an economy in a given year. Chart 2 shows the contribution made by three sectors — primary, industry, and services— to the aggregate economic growth.
Chart 2: Contribution to GDP(P) growth
We can immediately make a few observations. The primary sector —agriculture and fisheries — have been relatively stable over the years. Industry, on the other hand, drove the high growth rate in the half-decade preceding the pandemic. And both the industry and services sectors were buffeted by the pandemic, though it appears that the services sector has staged a stronger recovery.
Let’s explore these two sectors in a bit more detail.
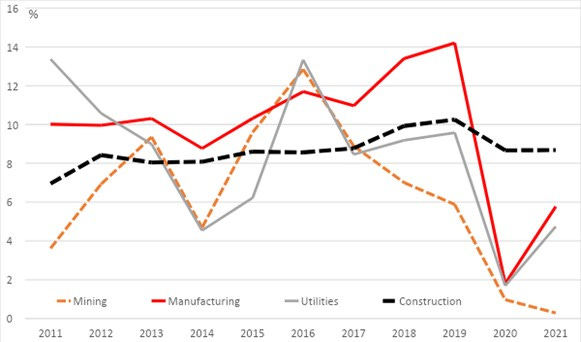
The industry sector comprises of mining, utilities, manufacturing, and construction. Manufacturing accounts for about two-thirds of the sector’s production, with construction adding nearly another quarter. Chart 3 shows that both the pre-Covid boom in industry growth and the sharp slowdown during the pandemic are driven by manufacturing.
Chart 3: Industry sector growth
Turning to the services sector, Chart 4 shows that retail and wholesale trade, hotels and restaurants, transport and communications, and finances were the worst affected ones in 2019-20, with all but finances staging a recovery in 2020-21.
Chart 4: Services sector growth
How do the above numbers stack up against what we know about the economy in recent years?
To the extent that most of Bangladesh’s manufacturing is exports-oriented, the timing of the manufacturing surge makes sense — the world economy was booming in 2018, with unemployment rates reaching decades low in many western economies, before softening due to the trade wars and policy uncertainties before the pandemic.
Turning to the services in 2019-20, trade, tourism and transport services were clearly the ones most affected by the lockdown. These too, then appear sensible. In the context of the general economic malaise, it’s not hard to understand the lack of recovery in finances.
That is, the production side of the economy tells a tale of an exports-driven manufacturing boom and bust plus the locked-down domestic services.
Production is, of course, only one side of an economy. Everything that is produced must be demanded by someone —classified in the expenditure side of the national accounts into demand from external (net exports), public, corporate (private investment), and household (private consumption) sectors. A considerably more complicated picture emerges when we look at the contribution to growth from these sources (Chart 5).
Chart 5: Contribution to GDP(E) growth
Consider the contribution of net exports to real GDP growth. In 2016-17 and 2017-18, when manufacturing was booming on the back of exports demand, net exports made a negative contribution to growth. Meanwhile, in 2020-21, with manufacturing yet to recover fully, net exports made a positive contribution to growth.
Chart 6 resolves this apparent contradiction. It turns out, exports did grow strongly prior to the pandemic and is yet to recover, consistent with the manufacturing numbers above. However, imports growth outpaced exports in 2016-17 and 2017-18, before turning sluggish even before the pandemic, with no recovery as of 2020-21.
Chart 6: Exports and Imports growth
What has been driving the imports growth?
In addition to being used as intermediate inputs for export items, imported machinery and capital equipment are used by businesses or in public investment projects.
Private investment growth has detracted over the past two years, thanks to the pandemic. Before that, private investment made a consistently strong contribution to economic growth. This means, the 2017-18 imports boom and the pre-pandemic softening are not likely to be caused by developments in the corporate sector.
Public demand and private consumption offer more promising answers. There indeed was an increase in public demand growth —both of public consumption and public investment —in 2016-17 and 2017-18 (Chart 7). This is also consistent with the strong growth in government production in those two years, shown in Chart 4 above.
Chart 7: Public demand growth
Meanwhile, according to the BBS, private consumption grew a whopping 11% in 2017-18, after growing by over 7% the previous years. Then it slumped to less than 4% growth in 2018 19, and have clocked about 5% a year in the two latest years. That is, the boom of the pre-pandemic import matches the consumption pattern.
Taken together, might we surmise this story: in addition to an exports-driven manufacturing boom, a fiscal expansion in the run-up to the 2018 election led to an import binge, and we were witnessing its hangover unfold in 2019, well before the pandemic struck.
Poring through the fiscal accounts, the balance of payments, and banking sector data would help get a more definitive answer. That is for another time. For now, let’s note that the BBS national accounts are, at least, internally consistent.
Estimating economic data in a rapidly changing society is difficult even at the best of times. This is particularly so at times of unprecedented crises such as the pandemic. Willfully distorting data to hide bad news is akin to turning off headlights on a foggy highway. It’s great that the BBS has stopped doing so.
All data are sourced from the CEIC Asia Database. A version of this piece was first published in the Business Standard.


