Charting Progress - I
Fifty years of Bangladesh in charts.
To mark fifty years of Bangladesh, this post (the first in a series) presents a set of charts to show the country’s economic evolution since the 1970s.
We begin with GDP per capita — a common, albeit imperfect, correlate of living standards over time and across countries. Late last year, there was considerable media hype about Bangladesh overtaking India in GDP per capita. However, according to the World Bank’s World Development Indicator, GDP per capita was about a quarter higher in the then East Pakistan than India in 1970 (Chart 1). The same data also suggests that GDP per capita in Pakistan’s eastern wing was less than two-thirds of that of the west in 1970, a relativity that had almost reversed by 2019. Finally, the chart also compares Bangladesh with other countries in tropical Asia.
The problem with Chart 1, however, is that this measure does not take into account prices differences across time and between countries. Splicing together official data from the Bangladesh Bureau of Statistics with that of WB WDI, Chart 2 shows real GDP per capita. In 2018-19, according to the official data, every Bangladeshi on average produced (alternatively, earned) goods and services worth around 154,000 taka. This compares with average production, and income, of about 50,200 taka in 1970. That is, after accounting for changes in prices, there has been a threefold increase in average income — on average, a Bangladeshi today is about three times as well off than their grandparents were on the eve of the Liberation War.
Chart 2 also shows that directly as a result of the War, real GDP per person dropped by over 10,000 taka. Pre-war income levels would not be reached until 1991.
Pause and reflect on that for a minute — for the post-War generation, freedom must have tasted bittersweet at best!
Chart 3 shows that incomes fell by a fifth in the aftermath of the War. By way of comparison, this is similar in magnitude as that experienced in Iraq during 2002-04.
This chart also shows that growth has become faster and more durable over time. Reflecting the large agriculture sector, incomes fluctuated widely from year to year even before the War, a trend that continued in the 1970s. Underneath the volatility, real incomes per person grew by 1% a year in the then East Pakistan and 1.5% in the post-War Bangladesh. The pace accelerated to over 2% in the 1990s, and nearly 5% since the mid-2000s. To put that in context, at the then East Pakistani pace, it would take over seven decades for average income (and thus living standards) to double, whereas with the more recent rates, average income has more than doubled since 2003.
So, how does Bangladesh compare with neighbours when price differences are taken into account?
Chart 4 shows this by using the IMF’s estimate of real GDP per capita measured in purchasing power parity terms. According to this estimate, the average Bangladeshi produced and earned about half as much as an average Pakistani even in the early 1990s, but the former had caught up with the latter by 2019.
On the other hand, average income was higher in Bangladesh than India in the early-to-mid 1980s, but the media headlines notwithstanding, when measured properly, the average Indian currently has higher income than the average Bangladeshi.
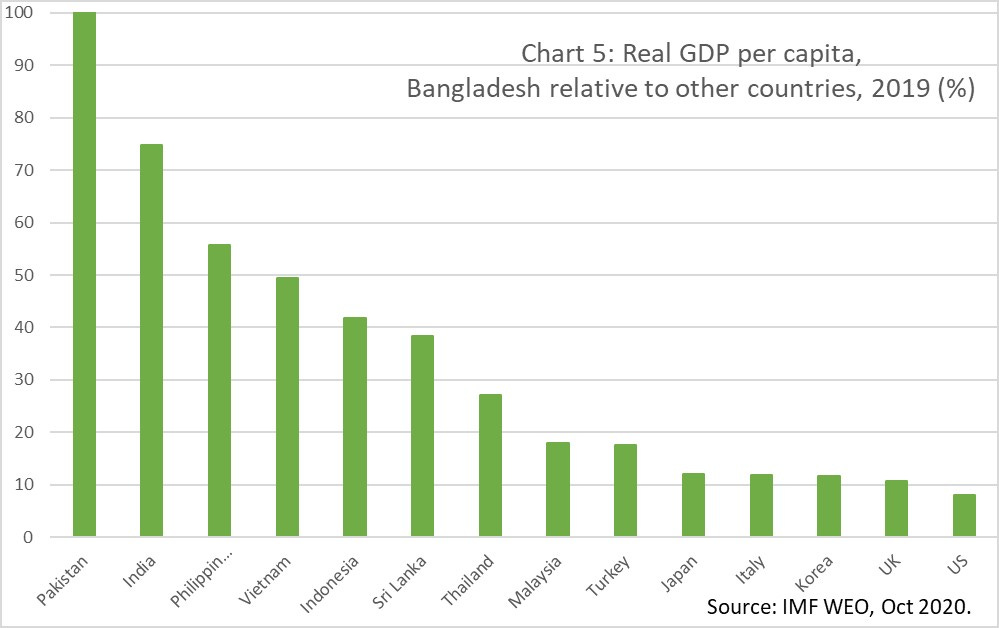
Chart 5 presents real GDP per capita in Bangladesh as percentage of that of neighbours as well as a number of advanced economies. The reference year is 2019 to avoid the effects of the pandemic. At that time, the average Bangladeshi had an income level, and thus standard of living, that was only about three-quarters of that of an average Indian. Further, the average Vietnamese was about twice, the average Thai nearly four times, and the citizens of the rich countries about ten times as well off as the average Bangladeshi.
Bangladesh has come far from its war-ravaged early days, even though there remains considerable challenge. More importantly, underneath these averages, what has been happening to the distribution of incomes? Have the poor benefitted as much from the growth as the rich?
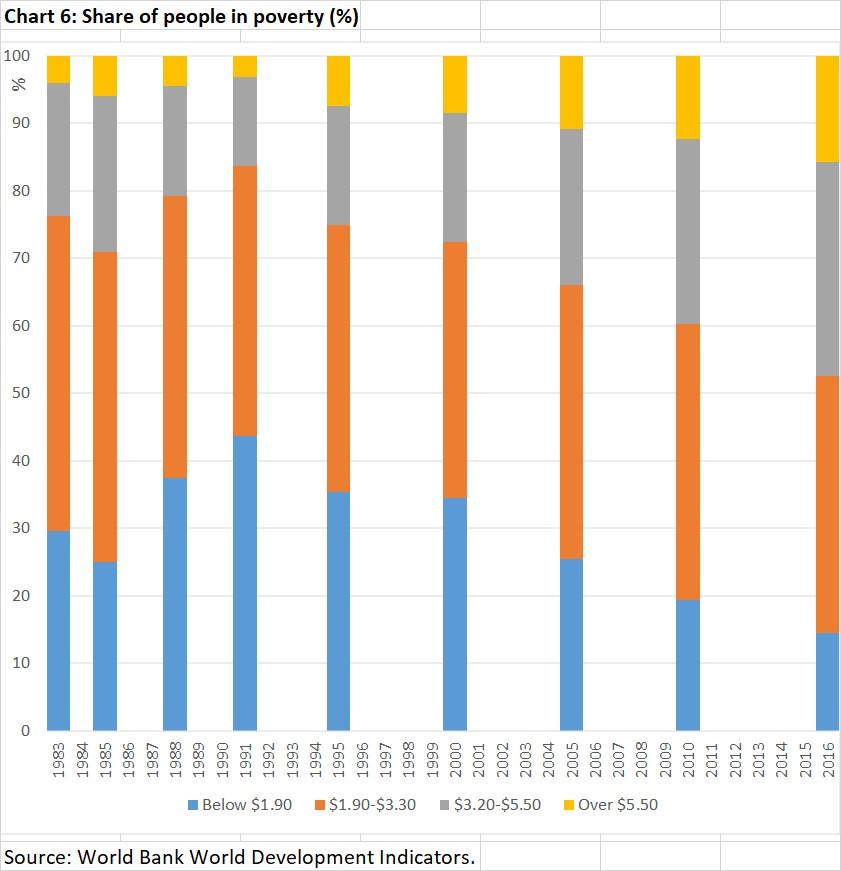
The World Bank considers people living on less than $1.90 a day (measured in 2011 prices, after accounting for price differences around the world) as being in extreme poverty. Two less acute measures of poverty are daily incomes of less than $3.20 a day and less than $5.50. Whichever measure is used, Chart 6 shows that after rising in the 1980s, the share of people living in poverty declined steadily between 1990 and 2016.
Chart 7 compares Bangladesh with a number of neighbours in the south and southeast Asia with respect to the evolution of the share of people in extreme poverty in the vertical axis with GDP per capita (measured in purchasing power parity) in the horizontal axis.
Two things stand out. First, as one would expect, the incidence of poverty declines as average income rises. Second, while Bangladesh has reduced poverty at a lower level of per capita income compared with some of the neighbours, it remains a relatively poverty-stricken land.
While the poor have benefitted from growth, did they benefit as much as the rich? Has the rising tide lifted all boats equally?
Gini coefficient is a measure of inequality. A co-efficient closer to zero signifies a more equal society, whereas the closer the value is to 100, the higher the inequality. Compared with the 1980s, Bangladesh has become a more unequal place in recent decades (Chart 8). Nonetheless, compared with many of the neighbours, Bangladesh remains a relatively more egalitarian place (Chart 9).
That Bangladesh may not be as unequal as other countries in monsoon Asia is no cause for complacency.
This is particularly highlighted by the most recent Household Income and Expenditure Survey of the Bangladesh Bureau of Statistics. This survey reports the average monthly income per household where the households are grouped according to income ranges.
According to the survey, and as shown in Chart 10, the average monthly income hardly moved for most households between 2010 and 2016, except for two groups. Over that period, the richest households saw their monthly income increase by nearly a quarter to over Tk 77,000. In contrast, the poorest households saw their monthly income decline by a third to less than Tk 700.
For all the progress made since independence, Bangladesh was still a regressive land in the 2010s.
Over time, an economy grows from two sources: the number of workers in the formal market, and the productivity of each worker. The economic growth in Bangladesh has accelerated steadily in the past three decades, but employment growth made a stronger contribution to growth in the 1990s than in recent decades (Table 1).
Employment growth, in turn, depends on two factors: demography, which underpins the number of potential workers; and the labour market, which determines where jobs are created, and for whom.
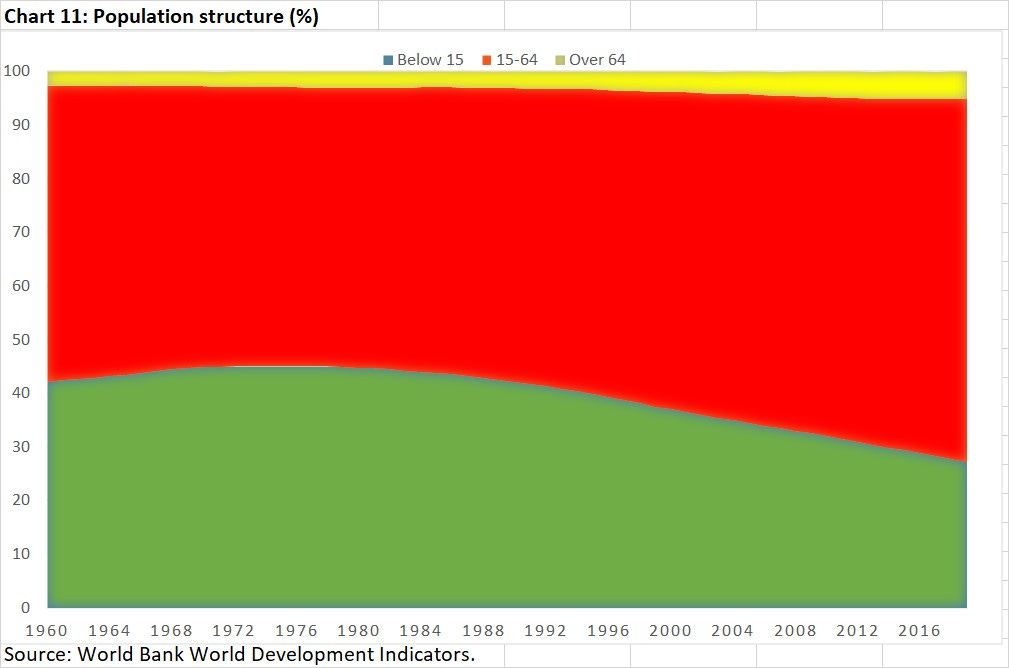
Bangladesh has been experiencing a demographic transition over recent decades, increasing the number of potential workers, as shown in Chart 11. Until the 1980s, over two-fifths of Bangladeshis were too young to work formally. The share of children in total population has been steadily declining in more recent decades, approaching a quarter by 2019. The share of working age (16-64 years old) people, on the other hand, increased from over half to two-thirds in that time.
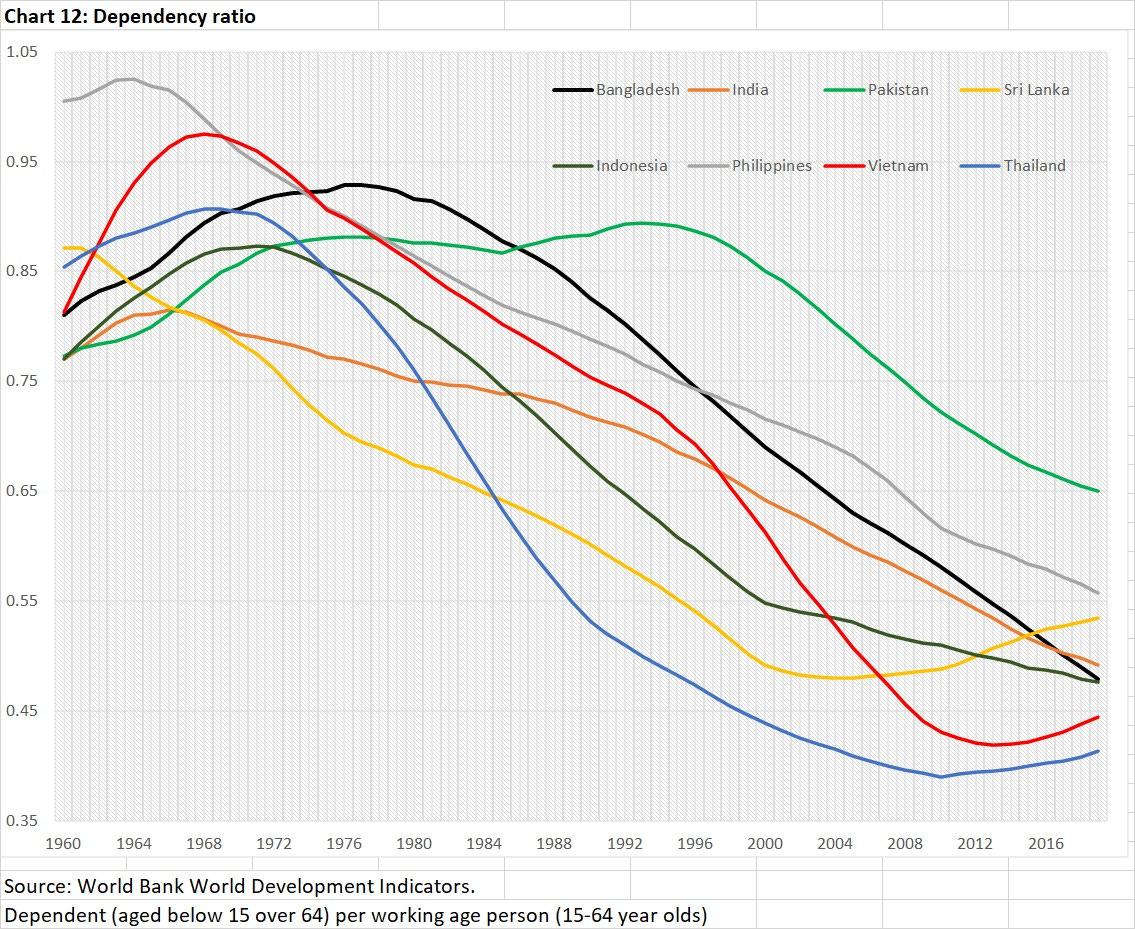
Dependency ratio —the number of dependent (both children and the elderly) per working age person —shows how the demographic structure can help or hinder people’s ability to join the workforce. Obviously, a couple looking after one dependent (dependency ratio of half) has more ability to participate in income generating activities than a couple looking after two dependents (dependency ratio of one).
Chart 12 shows that dependency ratio across South and Southeast Asia. Bangladesh has a relatively favourable demographic structure —not only is there room to further decline in the ratio, some of our neighbours are seeing an uptick in the ratio, reflecting ageing of their societies.
Of course, just because there are more people potentially available to work does not mean they are actually working. For Bangladesh to reap the so-called demographic dividend, the economy must create enough income generating jobs. Historically, for a small, densely populated country such as Bangladesh, the process of economic development has meant people leaving rural farms for urban factories.
Chart 13 shows that a similar process has been happening Bangladesh in recent decades. Whereas two-thirds of workers tilled the farm in the early 1990s, less than two-fifths worked in agriculture by 2019. Meanwhile, industry’s share of total employment doubled to over a fifth in that time.
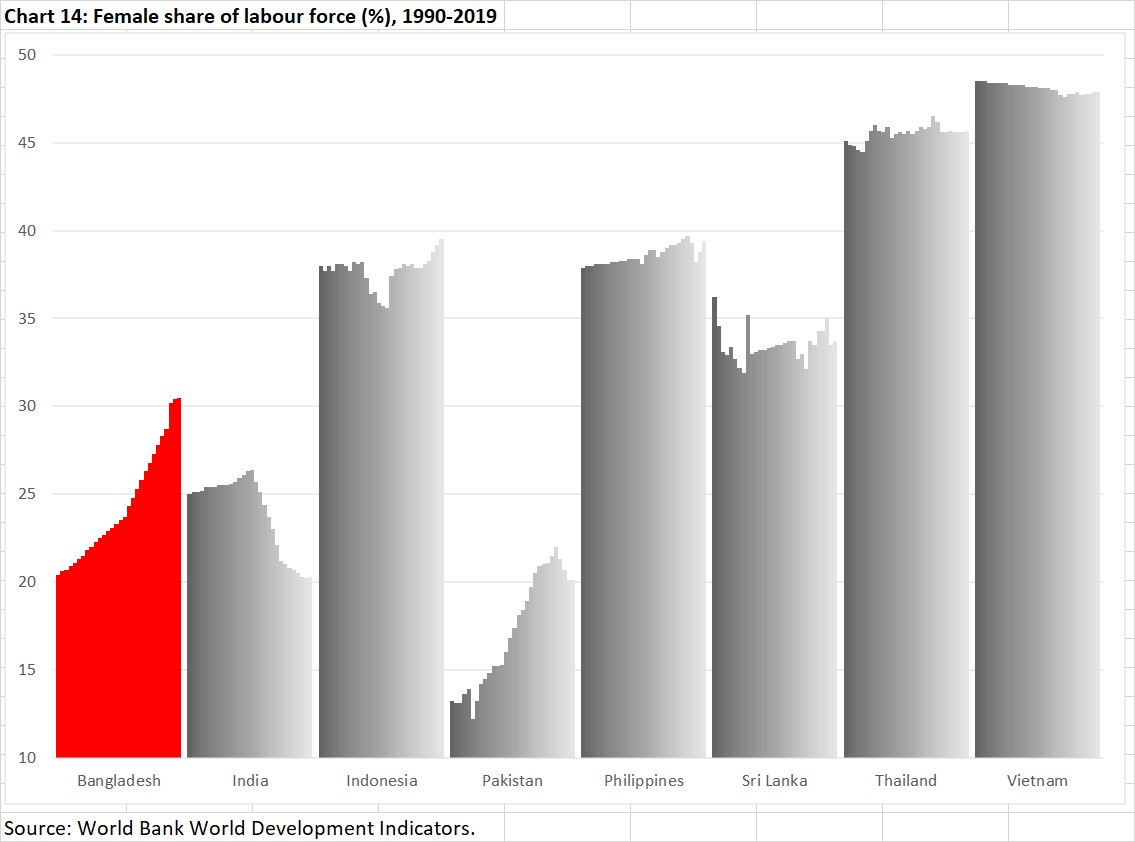
This reflects the readymade garments industry, the story of which is well known, as is its employment of millions of women, ushering in social as well as economic change. In the early 1990s, for example, only one in every five workers in Bangladesh was female. By the late 2010s, one in every three was. This progress notwithstanding, there is room for improvement. While Bangladesh fares better than our South Asian neighbours, women make up higher proportion of workforce in Southeast Asia (Chart 14).
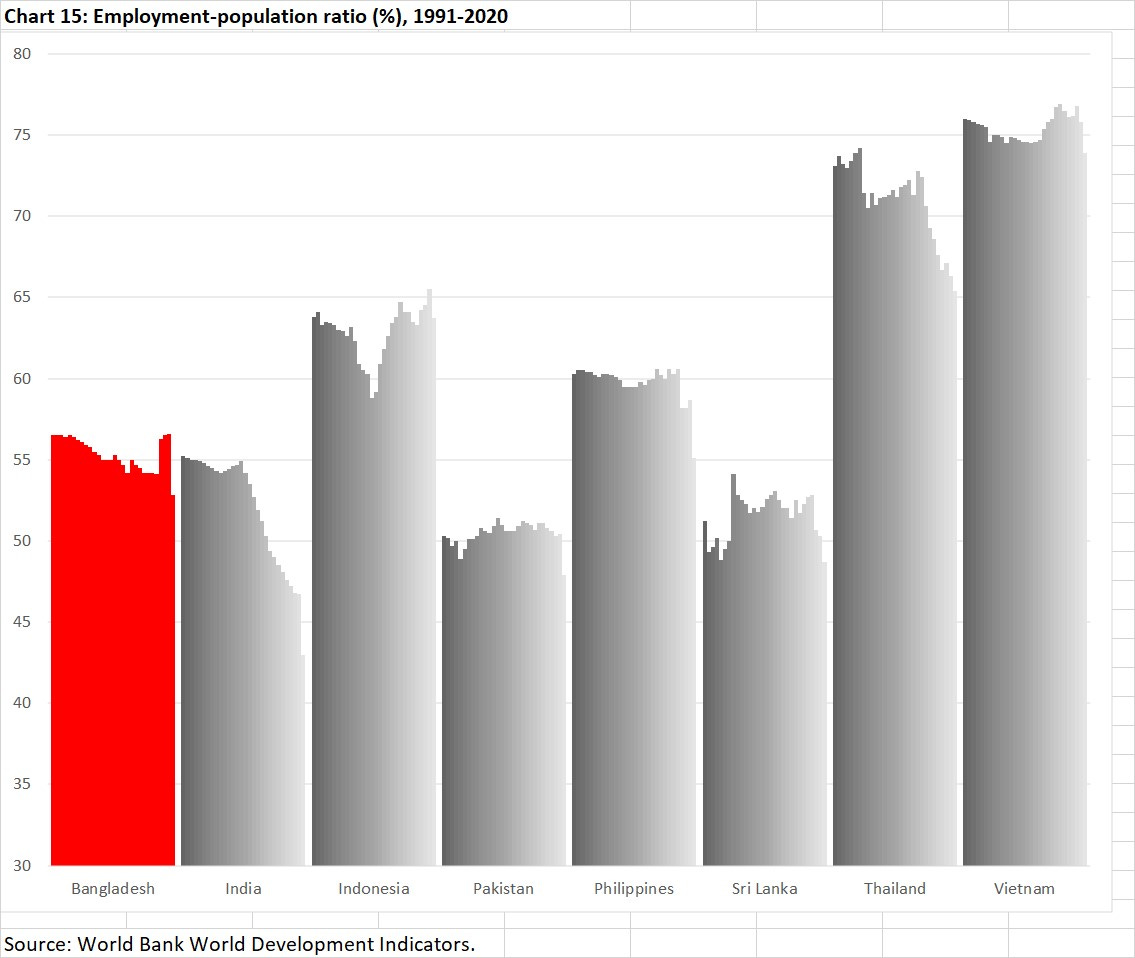
Similarly, employment to population ratio in Bangladesh is lower than in Southeast Asia (Chart 15). For example, over recent decades, while less than three-fifths of Bangladeshis were in formal employment, nearly three-quarters of Vietnamese were.
Bangladesh needs to create millions of more jobs to avoid a dystopia of non-working urban poverty.
These charts were first printed in the Dhaka Tribune.


